Z Werte berechnen
Z Wert Tabelle ist ein Darstellung mit Werten der Normalverteilung. Die Z – Werte werden benutzt, um die Wahrscheinlichkeit (z) für die Normalverteilung zu ermitteln.
Die Tabelle Normalverteilung wird zum Beispiel benutzt, um eine Bestätigung für die Voraussetzung zur Errechnung der Prozessfähigkeit zur gewährleisten. Aussagen zur Prozeßfähigkeit können nur getroffen werden, wenn die Prozesse stabil und normalverteilt sind.
Der Z-Wert selbst ist eine standardisierte Form eines Wertes einer Normalverteilung und gibt an, wie viele Standardabweichungen dieser Wert vom Mittelwert entfernt ist.
Die Normalverteilung wird durch ihre Glockenkurve dargestellt, wobei der Mittelwert der Höchstpunkt der Kurve ist. Werte, die weit vom Mittelwert entfernt liegen, haben kleinere Wahrscheinlichkeiten und sind seltener.
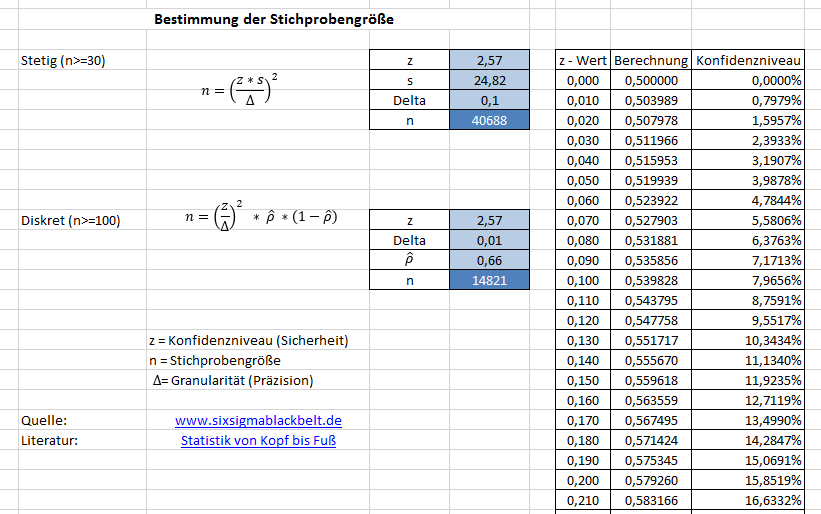
Die Werte der Tabelle lassen sich auch Excel berechnen und finden sich in der Stichprobe Excel Vorlage 2015 07 08.xls. Wie man eine repräsentative Stichprobe berechnet finden Sie hier. Ein Test auf Normalverteilung mit Excel findet ihr im Beitrag Test auf Normalverteilung in Excel nach Anderson Darling
Z Wert Tabelle
Die Berechnung gibt folgende z Werte aus.
Die Tabelle besteht aus zwei Teilen:
1. Die Zeilen führen die erste Dezimalstelle des Z-Wertes auf.
2. Die Spalten führen die zweite Dezimalstelle des Z-Wertes auf.
Für einen Z-Wert von 1,23 sucht man in der Zeile für 1,2 und der Spalte für 0,03. An der Schnittstelle dieser Zeile und Spalte findet man den Wert 0,8907. Dies bedeutet, dass 89,07% der Werte kleiner oder gleich 1,23 sind.
Beispiel: linke Zeile Wert 1,0* + entsprechende Spalte 1 ergibt z Wert = 1,01 entspricht einem Anteil von 0,84375.
| z \ * | 0 | 1 | 2 | 3 | 4 | 5 | 6 | 7 | 8 | 9 |
| 0,0* | 0,50000 | 0,50399 | 0,50798 | 0,51197 | 0,51595 | 0,51994 | 0,52392 | 0,52790 | 0,53188 | 0,53586 |
| 0,1* | 0,53983 | 0,54380 | 0,54776 | 0,55172 | 0,55567 | 0,55962 | 0,56356 | 0,56749 | 0,57142 | 0,57535 |
| 0,2* | 0,57926 | 0,58317 | 0,58706 | 0,59095 | 0,59483 | 0,59871 | 0,60257 | 0,60642 | 0,61026 | 0,61409 |
| 0,3* | 0,61791 | 0,62172 | 0,62552 | 0,62930 | 0,63307 | 0,63683 | 0,64058 | 0,64431 | 0,64803 | 0,65173 |
| 0,4* | 0,65542 | 0,65910 | 0,66276 | 0,66640 | 0,67003 | 0,67364 | 0,67724 | 0,68082 | 0,68439 | 0,68793 |
| 0,5* | 0,69146 | 0,69497 | 0,69847 | 0,70194 | 0,70540 | 0,70884 | 0,71226 | 0,71566 | 0,71904 | 0,72240 |
| 0,6* | 0,72575 | 0,72907 | 0,73237 | 0,73565 | 0,73891 | 0,74215 | 0,74537 | 0,74857 | 0,75175 | 0,75490 |
| 0,7* | 0,75804 | 0,76115 | 0,76424 | 0,76730 | 0,77035 | 0,77337 | 0,77637 | 0,77935 | 0,78230 | 0,78524 |
| 0,8* | 0,78814 | 0,79103 | 0,79389 | 0,79673 | 0,79955 | 0,80234 | 0,80511 | 0,80785 | 0,81057 | 0,81327 |
| 0,9* | 0,81594 | 0,81859 | 0,82121 | 0,82381 | 0,82639 | 0,82894 | 0,83147 | 0,83398 | 0,83646 | 0,83891 |
| 1,0* | 0,84134 | 0,84375 | 0,84614 | 0,84849 | 0,85083 | 0,85314 | 0,85543 | 0,85769 | 0,85993 | 0,86214 |
| 1,1* | 0,86433 | 0,86650 | 0,86864 | 0,87076 | 0,87286 | 0,87493 | 0,87698 | 0,87900 | 0,88100 | 0,88298 |
| 1,2* | 0,88493 | 0,88686 | 0,88877 | 0,89065 | 0,89251 | 0,89435 | 0,89617 | 0,89796 | 0,89973 | 0,90147 |
| 1,3* | 0,90320 | 0,90490 | 0,90658 | 0,90824 | 0,90988 | 0,91149 | 0,91309 | 0,91466 | 0,91621 | 0,91774 |
| 1,4* | 0,91924 | 0,92073 | 0,92220 | 0,92364 | 0,92507 | 0,92647 | 0,92785 | 0,92922 | 0,93056 | 0,93189 |
| 1,5* | 0,93319 | 0,93448 | 0,93574 | 0,93699 | 0,93822 | 0,93943 | 0,94062 | 0,94179 | 0,94295 | 0,94408 |
| 1,6* | 0,94520 | 0,94630 | 0,94738 | 0,94845 | 0,94950 | 0,95053 | 0,95154 | 0,95254 | 0,95352 | 0,95449 |
| 1,7* | 0,95543 | 0,95637 | 0,95728 | 0,95818 | 0,95907 | 0,95994 | 0,96080 | 0,96164 | 0,96246 | 0,96327 |
| 1,8* | 0,96407 | 0,96485 | 0,96562 | 0,96638 | 0,96712 | 0,96784 | 0,96856 | 0,96926 | 0,96995 | 0,97062 |
| 1,9* | 0,97128 | 0,97193 | 0,97257 | 0,97320 | 0,97381 | 0,97441 | 0,97500 | 0,97558 | 0,97615 | 0,97670 |
| 2,0* | 0,97725 | 0,97778 | 0,97831 | 0,97882 | 0,97932 | 0,97982 | 0,98030 | 0,98077 | 0,98124 | 0,98169 |
| 2,1* | 0,98214 | 0,98257 | 0,98300 | 0,98341 | 0,98382 | 0,98422 | 0,98461 | 0,98500 | 0,98537 | 0,98574 |
| 2,2* | 0,98610 | 0,98645 | 0,98679 | 0,98713 | 0,98745 | 0,98778 | 0,98809 | 0,98840 | 0,98870 | 0,98899 |
| 2,3* | 0,98928 | 0,98956 | 0,98983 | 0,99010 | 0,99036 | 0,99061 | 0,99086 | 0,99111 | 0,99134 | 0,99158 |
| 2,4* | 0,99180 | 0,99202 | 0,99224 | 0,99245 | 0,99266 | 0,99286 | 0,99305 | 0,99324 | 0,99343 | 0,99361 |
| 2,5* | 0,99379 | 0,99396 | 0,99413 | 0,99430 | 0,99446 | 0,99461 | 0,99477 | 0,99492 | 0,99506 | 0,99520 |
| 2,6* | 0,99534 | 0,99547 | 0,99560 | 0,99573 | 0,99585 | 0,99598 | 0,99609 | 0,99621 | 0,99632 | 0,99643 |
| 2,7* | 0,99653 | 0,99664 | 0,99674 | 0,99683 | 0,99693 | 0,99702 | 0,99711 | 0,99720 | 0,99728 | 0,99736 |
| 2,8* | 0,99744 | 0,99752 | 0,99760 | 0,99767 | 0,99774 | 0,99781 | 0,99788 | 0,99795 | 0,99801 | 0,99807 |
| 2,9* | 0,99813 | 0,99819 | 0,99825 | 0,99831 | 0,99836 | 0,99841 | 0,99846 | 0,99851 | 0,99856 | 0,99861 |
| 3,0* | 0,99865 | 0,99869 | 0,99874 | 0,99878 | 0,99882 | 0,99886 | 0,99889 | 0,99893 | 0,99896 | 0,99900 |
| 3,1* | 0,99903 | 0,99906 | 0,99910 | 0,99913 | 0,99916 | 0,99918 | 0,99921 | 0,99924 | 0,99926 | 0,99929 |
| 3,2* | 0,99931 | 0,99934 | 0,99936 | 0,99938 | 0,99940 | 0,99942 | 0,99944 | 0,99946 | 0,99948 | 0,99950 |
| 3,3* | 0,99952 | 0,99953 | 0,99955 | 0,99957 | 0,99958 | 0,99960 | 0,99961 | 0,99962 | 0,99964 | 0,99965 |
| 3,4* | 0,99966 | 0,99968 | 0,99969 | 0,99970 | 0,99971 | 0,99972 | 0,99973 | 0,99974 | 0,99975 | 0,99976 |
| 3,5* | 0,99977 | 0,99978 | 0,99978 | 0,99979 | 0,99980 | 0,99981 | 0,99981 | 0,99982 | 0,99983 | 0,99983 |
| 3,6* | 0,99984 | 0,99985 | 0,99985 | 0,99986 | 0,99986 | 0,99987 | 0,99987 | 0,99988 | 0,99988 | 0,99989 |
| 3,7* | 0,99989 | 0,99990 | 0,99990 | 0,99990 | 0,99991 | 0,99991 | 0,99992 | 0,99992 | 0,99992 | 0,99992 |
| 3,8* | 0,99993 | 0,99993 | 0,99993 | 0,99994 | 0,99994 | 0,99994 | 0,99994 | 0,99995 | 0,99995 | 0,99995 |
| 3,9* | 0,99995 | 0,99995 | 0,99996 | 0,99996 | 0,99996 | 0,99996 | 0,99996 | 0,99996 | 0,99997 | 0,99997 |
| 4,0* | 0,99997 | 0,99997 | 0,99997 | 0,99997 | 0,99997 | 0,99997 | 0,99998 | 0,99998 | 0,99998 | 0,99998 |
Anwendung der Z-Wert Tabelle im Qualitätswesen
Im Qualitätswesen wird die Z-Wert Tabelle häufig zusammen mit der Prozessfähigkeitsanalyse verwendet. Diese Tabelle hilft Qualitätstechniker dabei, die Wahrscheinlichkeit zu berechnen, dass ein Prozess innerhalb bestimmter Spezifikationsgrenzen liegt.
Ein Beispiel aus der Praxis: Ein Hersteller möchte sicherstellen, dass der Durchmesser eines produzierten Bauteils einen bestimmten Toleranzbereich nicht überschreitet. Mit Hilfe der Z-Wert Tabelle kann der Hersteller die Wahrscheinlichkeit bestimmen, dass ein Bauteil diesen Anforderungen entspricht, basierend auf den gemessenen Prozessdaten.
Zusammenfassung Z Wert Tabelle
Die Z-Wert Tabelle ist ein essentielles Instrument für Qualitätstechniker, die statistische Prozesskontrolle durchführen. Sie ermöglicht eine standardisierte Bewertung von Prozessen und hilft dabei, die Wahrscheinlichkeit abzuschätzen, dass Prozesse innerhalb der festgelegten Spezifikationen liegen. In Verbindung mit der Berechnung des Z-Wertes unterstützt sie die präzise Analyse und Überwachung von Fertigungsprozessen.
Weitere wichtige Inhalte für Ihr Projekt!
Folgen Sie den einzelnen, unten stehenden Links und Sie gelangen zum Thema und den entsprechenden Excel Dateien. Das Bild mit allen Links zu den Themen können Sie als pdf (Werkzeuge_20150722_4_als_pdf) downloaden.
Die Excel Vorlagen für die Lean Tools laden Sie in dieser Excel Datei (Toolbox.xlsx) runter.
Das Komplettpaket Excel Vorlagen Messsystemanalyse und Prozessfähigkeit können Sie hier anfordern.
Organisieren – Define Phase
Messen – Measure Phase
- Pareto Diagramm
- Konfidenzintervall
- Boxplot Diagramm
- Ursache Wirkungs Diagramm
- Qualitäts Kennzahlen
- Ishikawa Diagramm
- Prozesskennzahlen
- Kick off
- Sipoc